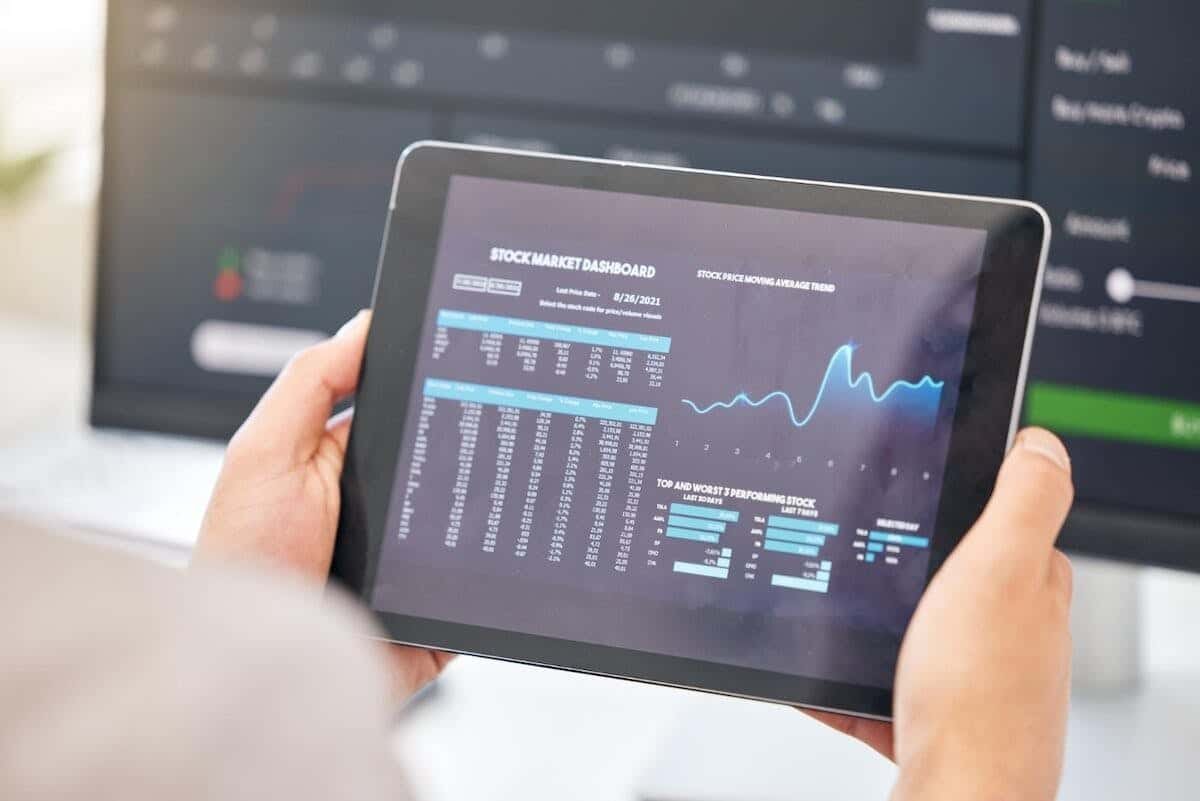

A breaking headline and a price chart tell two halves of the same story. “Nvidia beats earnings” is information; a 9% after-hours move is confirmation. On their own, each is incomplete — a headline with no price context can’t tell you whether the market already priced it in, and a price spike with no headline leaves you guessing why. The interesting work sits in the join between them.
This guide walks through building that join: a pipeline that pulls structured news from NewsData.io, maps each article to the instrument it’s about, and then pulls the real-time and historical price reaction from a market data API — so you can see, for any headline, exactly what price did in the minutes and hours around it.
Everything here is working code you can run today. You’ll need two API keys: one from NewsData.io for the news side, and one from Infoway for the market data side. Both offer a free tier with no credit card, which is enough to build and test the pipeline end to end. Two NewsData.io specifics are worth knowing before you go live, though: on the free plan the news feed is time-delayed rather than real-time, and a few fields and filters — the per-article sentiment field and the timeframe filter used in the live monitor below — are paid-plan features. Both are called out at the relevant step.
The Two Halves of the Pipeline
Before writing any code, it helps to be precise about which service owns which job:
| Layer | Service | What it provides |
|---|---|---|
| News | NewsData.io | Latest & historical articles, crypto news, keyword/category/country filtering, per-article sentiment and AI tags |
| Market data | Infoway | Real-time trades, OHLCV candlesticks, order-book depth, and WebSocket push for stocks, forex, and crypto |
The design principle is separation of concerns. NewsData.io answers “what is being said, and about what?” Infoway answers “what did the price do?” The glue code — mapping a headline to a ticker and aligning timestamps — is the part you write, and it’s where the value is.
Part 1: Pulling Structured News from NewsData.io
NewsData.io exposes a clean REST API. The endpoint you’ll use most is Latest News, which returns the most recently published articles across NewsData.io’s sources (on the free plan the feed is delayed rather than live; real-time delivery is a paid feature):
GET https://newsdata.io/api/1/latest
Authentication is a single apikey query parameter. The endpoint supports a rich set of filters — the ones that matter most for a market pipeline are q (keyword), category, country, language, and timeframe.
Here’s a first request that pulls recent business news mentioning a specific company:
import requests
 NEWSDATA_KEY = "pub_YOUR_NEWSDATA_KEY"
 resp = requests.get(
 "https://newsdata.io/api/1/latest",
 params={
 "apikey":   NEWSDATA_KEY,
 "q":        "Nvidia",
 "category": "business,technology",
 "language": "en",
 "country":  "us",
 },
 timeout=30,
 )
 payload = resp.json()
 print(f"status={payload['status']}  results={payload['totalResults']}")
 for article in payload["results"]:
 # sentiment is a real value only on paid plans; on the free plan it's a
 # placeholder string, so fall back to "n/a" for anything unexpected.
 sentiment = article.get("sentiment")
 if sentiment not in ("positive", "neutral", "negative"):
 sentiment = "n/a"
 print(f"[{article['pubDate']}] {article['title']}")
 print(f"    source: {article['source_id']}   sentiment: {sentiment}")
 print(f"    {article['link']}")
Each object in the results array is a fully structured article. The fields you’ll lean on for a market pipeline:
| Field | Why it matters |
|---|---|
article_id | Stable unique ID — use it to dedupe and to avoid re-processing an article |
title, description, content | The text you’ll scan for tickers and company names |
keywords | Pre-extracted keyword list — a shortcut for entity matching |
pubDate | UTC publish timestamp — the anchor you align price data against |
source_id, source_name | Which outlet ran it, useful for weighting credibility |
sentiment | positive / neutral / negative, classified per article — Professional/Corporate plans only |
ai_tag | AI-assigned topical tags (earnings, M&A, regulation, …) — paid plans |
country, category, language | The filters you queried on, echoed back (country and category come back as arrays) |
Pagination
NewsData.io uses cursor-based pagination. Each response includes a nextPage token; pass it back as the page parameter to walk through results:
 def fetch_all_news(query: str, max_pages: int = 5) -> list[dict]:
 """Walk NewsData.io pagination and collect articles."""
 articles, page, pages_read = [], None, 0
 while pages_read < max_pages:
 params = {"apikey": NEWSDATA_KEY, "q": query, "language": "en"}
 if page:
 params["page"] = page
 data = requests.get(
 "https://newsdata.io/api/1/latest", params=params, timeout=30
 ).json()
 articles.extend(data.get("results", []))
 page = data.get("nextPage")
 pages_read += 1
 if not page:
 break
 return articles
 headlines = fetch_all_news("Federal Reserve interest rate")
 print(f"Collected {len(headlines)} articles")
This is your news feed. Now it needs a price feed to talk to.
Part 2: The Market Data Side
For prices, this pipeline uses Infoway — a real-time market data API covering stocks, forex, and crypto through one account and one key. Authentication is a single header on every request:
apiKey: YOUR_INFOWAY_KEY
One thing to know up front: Infoway uses market-suffixed symbols rather than bare tickers, because it isn’t US-only:
| Market | Format | Example |
|---|---|---|
| US Equities | {TICKER}.US | AAPL.US, NVDA.US |
| Hong Kong | {code}.HK | 00700.HK |
| Japan | {code}.JP | 7203.JP |
| Crypto | pair symbol | BTCUSDT, ETHUSDT |
For a US-news pipeline you’ll mostly append .US. The three endpoints we’ll use:
- Latest trade — GET https://data.infoway.io/stock/batch_trade/{codes}
- Candlesticks (OHLCV) — POST https://data.infoway.io/stock/v2/batch_kline
- WebSocket push — wss://data.infoway.io/ws?business=stock&apikey=YOUR_KEY
A quick sanity check that the market side works — the latest price for a batch of symbols:
import requests
 INFOWAY_KEY = "YOUR_INFOWAY_KEY"
 resp = requests.get(
 "https://data.infoway.io/stock/batch_trade/NVDA.US,AAPL.US,TSLA.US",
 headers={"apiKey": INFOWAY_KEY},
 timeout=30,
 )
 for tick in resp.json()["data"]:
 print(f"{tick['s']:10s}  ${tick['p']:>10s}  vol={tick['v']}")
With both feeds proven out, we can connect them.
Part 3: Mapping a Headline to an Instrument
This is the glue. A headline says “Nvidia”; the price API wants NVDA.US. NewsData.io makes this easier than raw text-scraping, because it hands you a keywords array and (on paid tiers) ai_tag classifications alongside the title and body.
A pragmatic approach for a focused watchlist is a lookup table plus a scan across the article’s most reliable text fields:
# Map the names/tickers you care about to Infoway symbols.
WATCHLIST = {
 "nvidia": "NVDA.US",   "nvda": "NVDA.US",
 "apple":  "AAPL.US",   "aapl": "AAPL.US",
 "tesla":  "TSLA.US",   "tsla": "TSLA.US",
 "microsoft": "MSFT.US", "msft": "MSFT.US",
 }
 def match_symbol(article: dict) -> str | None:
 """Return an Infoway symbol if the article clearly references a watchlist name."""
 haystack = " ".join([
 article.get("title", ""),
 article.get("description", "") or "",
 " ".join(article.get("keywords") or []),
 ]).lower()
 for name, symbol in WATCHLIST.items():
 if name in haystack:
 return symbol
 return None
 tagged = []
 for art in fetch_all_news("Nvidia earnings"):
 symbol = match_symbol(art)
 if symbol:
 tagged.append({"symbol": symbol, "article": art})
 print(f"{symbol}  ←  {art['title']}")
For a broader, hands-off setup you’d swap the lookup table for a proper NER model (spaCy, or an LLM call) fed by the same title + description + keywords fields — but the lookup table is enough to get a real pipeline running, and it’s exactly what most single-desk or single-portfolio dashboards need.
Part 4: The Price Reaction — An Event Study
Now the payoff. For each tagged article we have a pubDate (UTC) and a symbol. The question is: what did price do around that timestamp? Infoway’s candlestick endpoint answers it. We pull minute bars and slice a window around the news.
The batch_kline endpoint takes a klineType (timeframe) and returns OHLCV bars:
klineType | Timeframe | klineType | Timeframe |
|---|---|---|---|
| 1 | 1-minute | 7 | 4-hour |
| 2 | 5-minute | 8 | Daily |
| 3 | 15-minute | 9 | Weekly |
| 5 | 1-hour | 10 | Monthly |
import requests, json
 from datetime import datetime, timezone
 INFOWAY_KEY = "YOUR_INFOWAY_KEY"
 def get_minute_candles(symbol: str, count: int = 500) -> list[dict]:
 resp = requests.post(
 "https://data.infoway.io/stock/v2/batch_kline",
 headers={"Content-Type": "application/json", "apiKey": INFOWAY_KEY},
 data=json.dumps({"codes": symbol, "klineType": 1, "klineNum": count}),
 timeout=30,
 )
 items = resp.json().get("data", [])
 for it in items:
 if it["s"] == symbol:
 return it["respList"]
 return []
 def news_reaction(symbol: str, pub_date: str, window_min: int = 30) -> dict | None:
 """Compare price just before a headline to `window_min` minutes after."""
 news_ts = datetime.strptime(pub_date, "%Y-%m-%d %H:%M:%S") \
 .replace(tzinfo=timezone.utc).timestamp() * 1000
 # Infoway kline timestamps are Unix SECONDS — scale to ms to match news_ts.
 def ts_ms(candle) -> int:
 return int(candle["t"]) * 1000
 candles = sorted(get_minute_candles(symbol), key=ts_ms)
 before = [c for c in candles if ts_ms(c) <= news_ts]
 after  = [c for c in candles if ts_ms(c) >  news_ts]
 if not before or not after:
 return None
 price_before = float(before[-1]["c"])
 window_after = [c for c in after if ts_ms(c) <= news_ts + window_min * 60_000]
 if not window_after:
 return None
 price_after = float(window_after[-1]["c"])
 move_pct    = (price_after - price_before) / price_before * 100
 return {
 "symbol":        symbol,
 "price_before":  round(price_before, 2),
 "price_after":   round(price_after, 2),
 "move_pct":      round(move_pct, 2),
 "window_min":    window_min,
 }
 # Tie it together: headline → symbol → price reaction
 for item in tagged:
 r = news_reaction(item["symbol"], item["article"]["pubDate"])
 if r:
 arrow = "▲" if r["move_pct"] >= 0 else "▼"
 print(f"{arrow} {r['symbol']}  {r['move_pct']:+.2f}%  in {r['window_min']}m "
 f"— {item['article']['title'][:60]}")
Sample output:
▲ NVDA.US  +4.18%  in 30m — Nvidia Q3 revenue tops estimates on AI chip demand
 ▼ TSLA.US  -2.05%  in 30m — Tesla recalls vehicles over software issue
That’s the whole idea in one screen: each row is a headline, joined to the market’s actual response. The candlestick endpoint’s minute resolution (with intraday history going back several years) is what makes this event-study framing possible — you’re not eyeballing a daily bar, you’re measuring the reaction inside the window that matters.
Part 5: Overlaying Sentiment on Price
NewsData.io’s per-article sentiment field lets you go one level further — not just did price move, but does the market’s move agree with the tone of coverage? Divergences (bad news, price up) are often the interesting ones. (sentiment is a real classification only on Professional and Corporate plans, for articles dated 2024-01-12 onward. On the free plan the key is still present but its value is the literal string “ONLY AVAILABLE IN PROFESSIONAL AND CORPORATE PLANS” — so guard against that placeholder rather than assuming a missing key, as the code below does.)
from collections import defaultdict
 def sentiment_vs_price(articles: list[dict]) -> None:
 buckets = defaultdict(list)
 for art in articles:
 symbol = match_symbol(art)
 if not symbol:
 continue
 reaction = news_reaction(symbol, art["pubDate"])
 if not reaction:
 continue
 sentiment = art.get("sentiment")
 if sentiment not in ("positive", "neutral", "negative"):
 continue
 buckets[sentiment].append(reaction["move_pct"])
 # Flag divergences: coverage and price disagree
 if sentiment == "negative" and reaction["move_pct"] > 1:
 print(f"⚠ DIVERGENCE  {symbol}  negative news, price {reaction['move_pct']:+.2f}%")
 print(f"    {art['title']}")
 print("\nAverage move by news sentiment:")
 if not buckets:
 print("  No sentiment data — needs a Professional or Corporate plan.")
 for sentiment, moves in buckets.items():
 avg = sum(moves) / len(moves)
 print(f"  {sentiment:10s}  {avg:+.2f}%   (n={len(moves)})")
Aggregated across enough articles, this becomes a genuine research tool: it tells you whether positive coverage on a name actually precedes upward moves, or whether the news is a lagging indicator that follows the price.
Part 6: Going Live — A Real-Time News & Price Monitor
Batch analysis is useful for research; a live desk wants push. Combine two loops: poll NewsData.io’s Latest endpoint with timeframe=15m (last 15 minutes) for fresh headlines, and subscribe to Infoway’s WebSocket for tick-by-tick price on whatever symbols the news surfaces.
Note on timeframe. In NewsData.io a bare number is hours (timeframe=15 = last 15 hours); append m for minutes (timeframe=15m = last 15 minutes). The timeframe filter — and real-time news delivery generally — requires a paid NewsData.io plan, so this live monitor is a paid-tier pattern. On the free plan, drop timeframe and poll on a slower cadence, accepting the feed delay.
import asyncio, json, uuid, requests, websockets
 NEWSDATA_KEY = "pub_YOUR_NEWSDATA_KEY"
 INFOWAY_KEY  = "YOUR_INFOWAY_KEY"
 class NewsPriceMonitor:
 def __init__(self):
 self.seen_ids: set[str] = set()
 self.watched: set[str] = set()
 self.ws = None
 # ---- news side: poll the Latest endpoint for fresh headlines ----
 async def poll_news(self):
 while True:
 # `requests` is synchronous, and calling it directly here would block
 # the event loop for the whole HTTP round trip — freezing the price
 # stream below on every poll. asyncio.to_thread runs it on a worker
 # thread and gives the loop back. (aiohttp is the alternative if you
 # don't mind the extra dependency.)
 resp = await asyncio.to_thread(
 requests.get,
 "https://newsdata.io/api/1/latest",
 params={"apikey": NEWSDATA_KEY, "q": "stocks OR earnings",
 "language": "en", "timeframe": "15m"},  # 15m = 15 minutes; "15" would mean 15 hours
 timeout=30,
 )
 data = resp.json()
 for art in data.get("results", []):
 if art["article_id"] in self.seen_ids:
 continue
 self.seen_ids.add(art["article_id"])
 symbol = match_symbol(art)
 if symbol:
 print(f"📰 {art['title']}  →  watching {symbol}")
 if symbol not in self.watched:
 self.watched.add(symbol)
 await self._subscribe(symbol)
 await asyncio.sleep(60)   # respect your NewsData.io rate tier
 # ---- price side: Infoway WebSocket push ----
 async def _subscribe(self, symbol: str):
 if self.ws:
 await self.ws.send(json.dumps({
 "code": 10000, "trace": str(uuid.uuid4()),
 "data": {"codes": symbol},
 }))
 async def stream_prices(self):
 url = f"wss://data.infoway.io/ws?business=stock&apikey={INFOWAY_KEY}"
 async with websockets.connect(url) as ws:
 self.ws = ws
 async for raw in ws:
 msg = json.loads(raw)
 if msg.get("code") == 10002:      # trade tick
 d = msg["data"]
 print(f"    💹 {d['s']}  ${d['p']}  vol={d['v']}")
 async def run(self):
 await asyncio.gather(self.poll_news(), self.stream_prices())
 asyncio.run(NewsPriceMonitor().run())
The result is a console that prints a headline the moment NewsData.io surfaces it, immediately starts streaming live trades for the affected symbol, and lets you watch the reaction unfold in real time. Swap the print calls for writes to a database, a Slack webhook, or a dashboard and you have a production news-and-price feed.
Part 7: The Crypto Variant
Crypto is where news moves price fastest, and both APIs have a dedicated crypto path — so the same pattern drops straight in.
NewsData.io’s Crypto endpoint adds a coin filter:
crypto_news = requests.get(
 "https://newsdata.io/api/1/crypto",
 params={"apikey": NEWSDATA_KEY, "coin": "btc,eth", "language": "en"},
 timeout=30,
 ).json()
 for art in crypto_news["results"]:
 # `coin` is a list of ticker symbols the article mentions, returned UPPERCASE
 # (e.g. ["BTC", "ETH"]) even though the `coin` filter above takes lowercase.
 coins = art.get("coin") or []
 print(f"[{art['pubDate']}] {art['title']}  (coins: {', '.join(coins)})")
On the price side, Infoway’s crypto endpoints mirror the stock ones — pair symbols like BTCUSDT instead of .US tickers, and a business=crypto WebSocket channel. Because crypto trades 24/7, there’s no market-hours gap to handle: every headline has a live price window around it, making the event-study join even cleaner than it is for equities.
# Latest crypto trade, same shape as the stock call
 btc = requests.get(
 "https://data.infoway.io/crypto/batch_trade/BTCUSDT,ETHUSDT",
 headers={"apiKey": INFOWAY_KEY},
 timeout=30,
 ).json()
Map each ticker in the coin array NewsData.io returns (uppercase, e.g. [“BTC”, “ETH”]) to the pair symbol (BTCUSDT, ETHUSDT) — normalize case when you build the lookup — and the exact same news_reaction() function works unchanged.
Rate Limits & Practical Notes
Both services have free tiers generous enough to build the full pipeline:
- NewsData.io returns 10 articles/request on the free tier (50 on paid). The free plan’s feed is time-delayed (real-time delivery, the timeframe filter, and the per-article sentiment field are paid-plan features); plan into that from the start if you’re building the live monitor. Pagination follows the nextPage token; each /latest or /crypto call costs 1 API credit. For back-testing across a longer window, the Archive endpoint (/api/1/archive, 5 credits/call) reaches years of history.
- Infoway free tier allows 1 request/second (86,400/day) and up to 10 concurrently subscribed WebSocket symbols — plenty for a focused watchlist. Every REST endpoint accepts comma-separated symbols in a single call, so batch your price lookups rather than looping.
Two things that will save you debugging time:
- Timestamps. NewsData.io’s pubDate is UTC in YYYY-MM-DD HH:MM:SS format. Infoway’s timestamps are Unix epoch but the unit differs by endpoint — batch_kline bars use the t field in seconds, while batch_trade ticks report t in milliseconds. Scale everything to the same unit before comparing (the news_reaction() code multiplies the candle seconds by 1000) — a unit or timezone mismatch is the most common way an event study ends up silently misaligned, with every candle landing on one side of the headline.
- Market hours. For equities, a headline that drops at 2 a.m. has no intraday candle until the open. Decide deliberately whether you measure the reaction from the pre-market print, the prior close, or the next regular-session bar — the crypto path sidesteps this entirely.
FAQ
Do I need paid tiers for both APIs to build this?
No — the free tiers of both NewsData.io and Infoway are enough to build and test the whole pipeline. Two capabilities do require a paid NewsData.io plan, though: real-time (undelayed) news with the timeframe filter, which the live monitor in Part 6 depends on, and the per-article sentiment field used in Part 5. The batch event-study core (Parts 1–4) runs entirely on the free tier. You’ll also want to upgrade when you move from a handful of watched symbols to broad coverage, or when you need NewsData.io’s Archive endpoint for long-history back-tests.
How do I match a headline to a ticker reliably?
Start with a lookup table keyed on the company names and tickers you actually track — it’s simple and precise for a defined watchlist. NewsData.io’s keywords array and ai_tag fields give you cleaner text to match against than raw HTML. For open-ended coverage, feed the title + description into a named-entity-recognition model or an LLM call and resolve the extracted entity to a symbol.
Can I back-test this on historical news instead of live headlines?
Yes — swap NewsData.io’s Latest endpoint for its Archive endpoint to pull news from a chosen date range, then pull the matching historical candles from Infoway (daily and above have no lookback limit; minute bars go back several years). The news_reaction() function doesn’t change.
Why keep news and market data in separate services?
Separation of concerns. A dedicated news API gives you far better coverage, deduplication, sentiment, and source metadata than scraping headlines yourself, while a dedicated market data API gives you clean, low-latency OHLCV and tick data across markets. The join between them is thin — a symbol map and a timestamp alignment — and keeping the two feeds independent means you can upgrade or swap either side without touching the other.
Does the crypto path really reuse the same code?
Almost entirely. NewsData.io’s Crypto endpoint returns the same article shape plus a coin field (a list of uppercase ticker symbols), and Infoway’s crypto endpoints return the same trade/candle shape as the stock ones. The only mapping you add is each coin ticker → pair symbol (e.g. BTC → BTCUSDT), normalizing case as you go. Because crypto trades around the clock, you also drop all the market-hours handling.

Raghav Sharma is a content writer and media researcher at Newsdata.io, specializing in news industry analysis, media literacy, and the evolving landscape of digital journalism. With a background in English Literature and Journalism, along with a focus on fact-based reporting standards, Raghav covers topics including news API technology, editorial bias evaluation, and responsible information consumption. Raghav’s work has covered media trends across categories, including healthcare news, international journalism, and API-driven publishing. You can connect with him on LinkedIn or explore more of his writing on the Newsdata.io blog.